Beyond EUI: Why Energy Use Intensity Doesn’t Tell the Whole Story
Energy Use Intensity (EUI) has become the go-to metric for evaluating building energy performance. Expressed in kBtu per square foot per year (or kWh/m²/year), it provides a seemingly straightforward way to compare buildings and set performance targets. But as our recent experience with a campus center project demonstrates, EUI alone can paint a misleading picture of building performance—and sometimes penalize the most successful projects.
The Campus Center Story: When “Failure” Reveals Success
A few years ago, our team completed comprehensive energy modeling for a new campus center, supporting decision-making from the schematic design phase through building envelope optimization, lighting design, HVAC system selection, and controls strategies. We were confident in our modeling approach and excited to see how the building would perform in operation.

When the building opened and we began Measurement and Verification (M&V), the initial results were concerning. Monthly electricity use was running approximately 20% higher than our energy model had predicted. At first glance, this looked like a significant modeling miss—the kind of discrepancy that calls into question both the modeling process and the building’s performance.
But energy professionals know that the real insights come from digging deeper into the data. What we discovered when we investigated the higher-than-expected energy use was remarkable and fundamentally changed how we think about building performance metrics.
The Diagnostic Tool: Heat Mapping Energy Performance
To quickly identify where and when the energy use discrepancies were occurring, we employed a method we call “heat mapping.” This analytical approach has proven invaluable for pinpointing the root causes of energy performance variations.
The Heat Mapping Process:
- Data Organization: Using Excel pivot tables, we summarize average energy use over a specific time period (typically a year or month) for every day type and hour of the day, creating a grid with days of the week as columns and hours as rows.
- Comparison Analysis: We create a third dataset where we divide actual building energy use by modeled building energy use for each time period.
- Visual Pattern Recognition: Using Excel’s conditional formatting, we generate a color-coded “heat map” that instantly reveals patterns in building energy performance discrepancies.
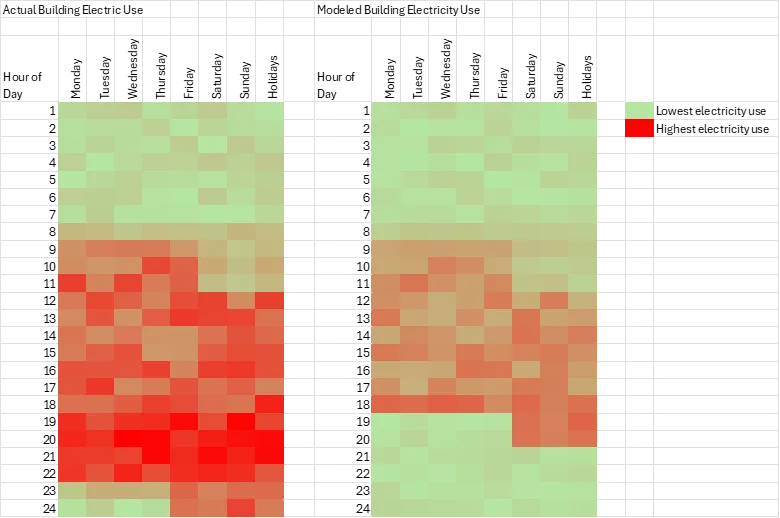
This heat mapping analysis immediately alerted us that the usage patterns of the building were significantly different than originally anticipated. The visual pattern showed clear extensions beyond the original 9am-5pm schedule and intensification during traditional peak hours—insights that would have taken much longer to identify through traditional data analysis methods.
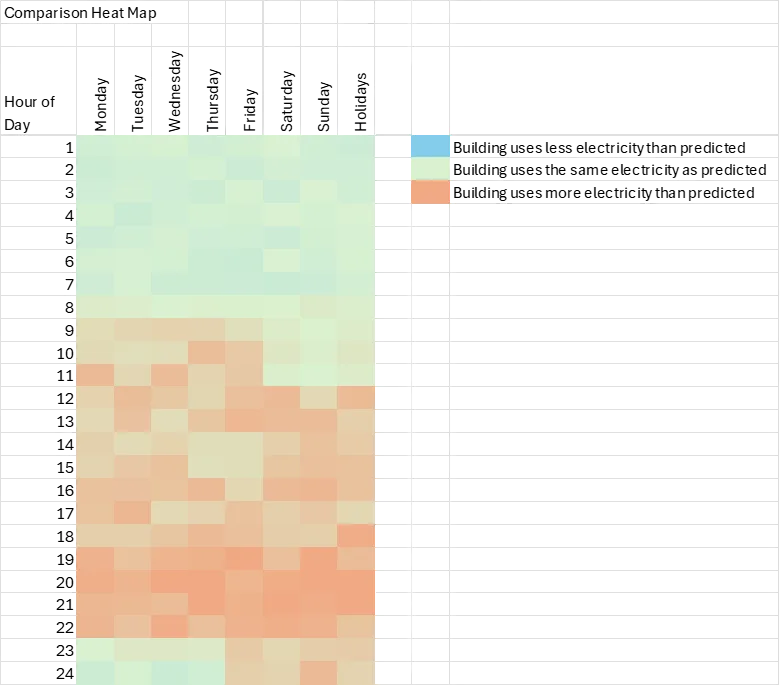
Note: The heat map image and all data presented in this article are from a generic, anonymized representation of the project to protect client confidentiality while illustrating the analytical methodology.
The Real Story: Exceptional Building Utilization
The building wasn’t performing poorly—our investigation revealed that the campus center was being used far more extensively than anyone had originally anticipated:
Original Design Assumptions:
- Operating hours: 9am to 5pm
- Moderate occupancy during peak hours
- Standard academic building usage patterns
Actual Usage Patterns:
- Operating hours: 8am to 10pm (25% longer days)
- Significantly higher occupancy during traditional peak hours (9am-5pm)
- Extended evening usage that hadn’t been programmed into the original design
The classrooms, dining center, gallery, and student spaces had student and faculty favorites. Faculty and students were choosing to spend time in these spaces well beyond what the original programming had anticipated. The building was delivering approximately twice the utilization for only 20% additional energy use.
Validating the Performance: The Power of Detailed Modeling
To verify our hypothesis, we adjusted the occupancy schedules in our model to reflect the actual usage patterns we observed. The results were striking: when we accounted for the increased hours of operation and higher occupancy levels, our modeling results snapped into place—showing only a 2% difference between predicted and actual energy use.
This validation demonstrated two critical points:
- The building was performing exactly as designed for the loads and schedules it was actually experiencing
- Our energy modeling methodology was sound when provided with accurate operational assumptions
The 20% increase in energy use wasn’t a performance failure—it was the direct result of sucessful architecture.
The EUI Problem: When Metrics Mislead
This experience highlighted a fundamental flaw in relying solely on EUI as a performance metric. If we had evaluated this project based purely on EUI targets, it would have been classified as a failure:
- Target EUI: Based on standard occupancy assumptions
- Actual EUI: 20% higher than target
- Conclusion (EUI-only): Building underperforming
But the reality was exactly the opposite. When we consider more meaningful metrics:
- Energy per occupant-hour: Exceptional performance
- Energy per function delivered: Outstanding efficiency
- User satisfaction: Extremely high
- Space utilization: Far exceeded expectations
The Value of Whole Building Energy Modeling
This case study illustrates why whole building energy modeling for specific projects is far more valuable than relying on generic EUI targets. Detailed energy modeling can:
- Capture nuanced performance stories that missed by aggregate metrics
- Identify the root causes of unexpected energy use patterns
- Validate building performance when operational assumptions change
- Support data-driven decisions about building optimization
Programs focused solely on EUI targets would have completely missed this success story and potentially penalized a project that delivered exceptional value to its users.
Beyond EUI: Better Metrics for Building Performance
While EUI remains a useful benchmark, building performance evaluation should incorporate multiple metrics that tell a more complete story:
Occupant-Normalized Metrics:
- Energy use per occupant-hour
- Energy use per student served
- Energy use per event hosted
Functional Performance Metrics:
- Actual vs. programmed utilization rates
- User satisfaction scores
- Space effectiveness ratios
Contextual Performance Metrics:
- Performance relative to actual (not assumed) operations
- Energy use per unit of service delivered
- Comparative analysis with similar building types and usage patterns
Lessons Learned: The Importance of Context
Our campus center experience reinforced several critical lessons about building performance evaluation:
- Context matters more than absolute numbers. A building using more energy than predicted might be delivering exceptional value to its users.
- Operational assumptions are crucial. Energy models are only as accurate as the operational assumptions they’re based on.
- Success can look like failure when viewed through the wrong metrics. The most successful buildings might have higher EUIs than expected if they’re being used more intensively than anticipated.
- Measurement and verification is essential. M&V processes are essential to ensure continued building performance and learning.
- Multiple metrics provide better insights. No single metric can capture the full story of building performance.
Conclusion: Redefining Success
Our campus center taught us that building performance success isn’t just about hitting predetermined EUI targets—it’s about efficiently delivering the services and experiences that users need and want. Sometimes that means using more energy than originally anticipated, and that’s perfectly acceptable when the increased energy use corresponds to dramatically increased building utilization and user satisfaction.
As we continue to push toward more sustainable and efficient buildings, let’s ensure our metrics are sophisticated enough to recognize true success when we see it. The most important question isn’t just “How much energy does this building use?” but rather “How effectively does this building serve its users, and how efficiently does it deliver that service?”
The next time you see a building with a higher-than-expected EUI, dig deeper. You might just discover a tremendous success story hiding behind the numbers.
What has your experience been with energy modeling insights that challenged conventional metrics? Have you encountered buildings where EUI targets didn’t align with actual performance success? Share your stories and insights—the building industry learns best when we share these real-world experiences with each other.